An Error of Process
Posted on Wed 08 March 2017 in TDDA
Yesterday, email subscribers to the blog, and some RSS/casual viewers, will have seen a half-finished (in fact, abandoned) post that began to try to characterize success and failure on the crowd-funding platform Kickstarter.
The post was abandoned because I didn't believe its first conclusion, but unfortunately was published by mistake yesterday.
This post explains what happened and tries to salvage a "teachable moment" out of this minor fiasco.
The problem the post was trying to address
Kickstarter is a crowd-funding platform that allows people to back creative projects, usually in exchange for rewards of various kinds. Projects set a funding goal and backers only pay out if the aggregate pledges made match or exceed the funding goal during a funding period—usually 30 days.
Project Phoenix on Kickstarter, from The Icon Factory, seeks to fund the development of a new version of Twitterrific for Mac. Twitterrific was the first independent Twitter client, and was responsible for many of the things that define Twitter today.1 (You were, and are, cordially invited to break off from reading this post to go and back the project before reading on.)
Ollie is the bird in Twitterrific's icon.

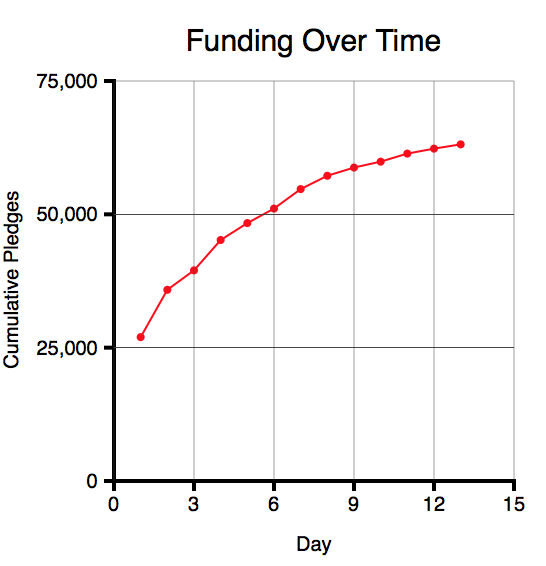
At the time I started the post, the project had pledges of $63,554 towards a funding goal of $75,000 (84%) after 13 days, with 17 days to go. This is what the amount raised over time looked like (using data from Kicktraq):
Given that the amount raised was falling each day, and looked asymptotic, questions I was interested in were:
- How likely was the project to succeed (i.e. to reach its funding goal by day 30? (In fact, it is now fully funded.)
- How much was the project likely to raise?
- How likely was the project to reach its stretch goal of $100,000?
The idea was to use some open data from Kickstarter and simple assumptions to try to find out what successful and unsuccessful projects look like.
Data and Assumptions
[This paragraph is unedited from the post yesterday, save that I have made the third item below bold.]
Kickstarter does not have a public API, but is scrapable. The site Web Robots makes available a series of roughly monthly scrapes of Kickstarter data from October 2015 to present; as well as seven older datasets. We have based our analysis on this data, making the following assumptions:
- The data is correct and covers all Kickstarter Projects
- That we are interpreting the fields in the data correctly
- Most critically: if any projects are missing from this data, the missing projects are random. Our analysis is completely invalid if failing projects are removed from the datasets.
[That last point, heavily signalled as critical, turned out not to be the case. As soon as I saw the 99.9% figure below, I went to try to validate that projects didn't go missing from month to month in the scraped data. In fact, they do, all the time, and when I realised this, I abandoned the post. There would have been other ways to try to make the prediction, but they would have been less reliable and required much more work.]
We started with the latest dataset, from 15th February 2017. This included data about 175,085 projects, which break down as follows.
Only projects with a 30-day funding period were included in the comparison, and only those for which we knew the final outcome.
count           is 30 day?
state           no     yes    TOTAL
failed      41,382  42,134   83,516
successful  44,071  31,142   75,213
canceled     6,319   5,463   11,782
suspended      463     363      826
live         2,084   1,664    3,748
TOTAL       94,319  80,766  175,085
-----------------------------------
less live:           1,664
-----------------------------------
Universe            79,102
The table showed that 80,766 of the projects are 30-day, and of these, 79,102
are not live. So this is our starting universe for analysis.
NOTE: We deliberately did not exclude suspended or canceled projects,
since doing so would have biased our results.
Various fields are available in the JSON data provided by Web Robots. The subset we have used are listed below, together with our interpretation of the meaning of each field:
launched_at— Unix timestamp (seconds since 1 January 1970) for the start of the funding perioddeadline— Unix timestamp for the end of the funding periodstate— (see above)goal— the amount required to be raised for the project to be fundedpledged— the total amount of pledges (today); pledges can only be made during the funding periodcurrency— the currency in which the goal and pledges are made.backers_count— the number of people who have pledged money.
Overall Statistics for 30-day, non-live projects
These are the overall statistics for our 30-day, non-live projects:
succeeded    count        %
no          47,839   60.48%
yes         31,263   39.52%
TOTAL       79,102  100.00%
Just under 40% of them succeed.
But what proportion reach 84% and still fail to reach 100%? According to the detailed data, the answer was just 0.10%, suggesting 99.90% of 30-day projects that reached 84% of their funding goal, at any stage of the campaign went on to be fully funded.
That looked wildly implausible to me, and immediately made me question whether the data I was trying to use was capable of supporting this analysis. In particular, my immediate worry was that projects that looked like they were not going to reach their goal might end up being removed—for whatever reason—more often that those that were on track. Although I have not proved that this is the case, it is clear that projects do quite often disappear between successive scrapes.
To check this, I went back over all the earlier datasets
I had collected and extracted the projects that were live
in those datasets. There were 47,777 such projects.
I then joined those onto the latest dataset
to see how many of them were in the latest dataset.
15,276 (31.97%) of the once-live projects were not in the
latest data (based on joining on id).
It was at this point I abandoned the blog post.
Error of Process
So what did we learn?
The whole motivation for test-driven data analysis is the observation that data analysis is hard to get right, and most of us make mistakes all the time. We have previously classified these mistakes as
- errors of interpretation (where we or a consumer of our analysis misunderstand the data, the methods, or our results)
- errors of implementation (bugs)
- errors of process (where we make a mistake in using our analytical process, and this leads to a false result being generated or propagated)
- errors of applicability (where we use an analytical process with data that does not satisfy the requirements or assumptions (explicit or implicit) of the analysis).
We are trying to develop methodologies and tools to reduce the likelihood and impact of each of these kinds of errors.
While we wouldn't normally regard this blog as an analytical process, it's perhaps close enough that we can view this particular error through the TDDA lens. I was writing up the analysis as I did it, fully expecting to generate a useful post. Although I got as far as writing into the entry the (very dubious) 99.9% of 30-day projects that reach 84% funding at any stage on Kickstarter go on to be fully funded, that result immediately smelled wrong and I went off to try to see whether my assumptions about the data were correct. So I was trying hard to avoid an error of interpretation.
But an error of process occurred. This blog is published using
Pelican, a static site generator
that I mostly quite like. The way Pelican works is posts are (usually)
written in Markdown
with some metadata at the top. One of the bits of metadata is
a Status field, which can either be set to Draft or Published.
When writing the posts, before publishing, you can either run a local
webserver to view the output, or actually post them to the main site
(on Github Pages, in this case). As long as their status is set to
Draft, the posts don't show up as part of the blog in either site (local
or on Github), but have to be accessed through a special draft URL.
Unfortunately, the draft URL is a little hard to guess, so I generally
work with posts with status set to Published until I push them to
Github to allow other people to review them before setting them live.
What went wrong here is that the abandoned post had its status left as
Published, which was fine until I started the next post (due tomorrow)
and pushed that (as draft) to Github. Needless to say, a side-effect
of pushing the site with a draft of tomorrow's post was that the
abandoned post got pushed too, with its status as Public. Oops!
So the learning for me is that I either have to be more careful
with Status (which is optimistic) or I need to add some protection
in the publishing process to stop this happening. Realistically,
that probably means creating a new Status—Internal—which will
get the make process to transmogrify into Published
when compiling locally, and Draft when pushing to Github.
That should avoid repeats of this particular error of process.
-
good things, like birds and @names and retweeting; not the abuse. ↩